The importance of accurate measurements in electronics
Accurate measurement of electronic connector pin positions is crucial for professionals in electronic manufacturing. Traditional measurement methods can be time-consuming and are often prone to human error. Moreover, these methods typically do not allow for thorough evaluation of the internal structures of the components, which are highly relevant for correct functioning later on.
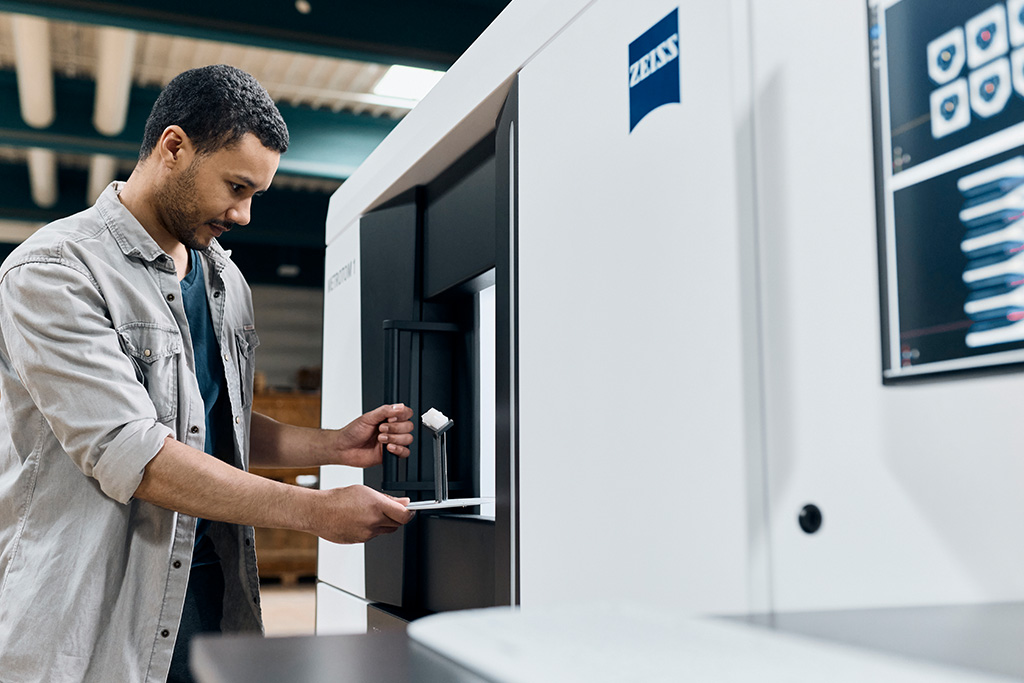
Instead of relying solely on manual inspection – which can be subjective and labor-intensive – 3D scanning with ZEISS METROTOM 1 provides a comprehensive digital representation of the connector, both inside and out. This ensures that no detail is overlooked.
Your go-to: CT technology for comprehensive 3D models of electronic parts
3D scanning based on CT technology is straightforward. Start by placing the plastic electrical connector housing on an angled foam fixture – no further part preparation is needed. All that’s left to do is putting the fixtured part in the CT scanner, closing the door and initiating a first scan. ZEISS METROTOM 1 scans your parts in just a couple of minutes, making it a good choice for manufacturers who are seeking for more efficient quality control workflows.
These become even more efficient when the full potential of the METROTOM 1 is utilized. Did you know that you can even inspect several parts at the same time? Just adapt the fixture to a multitude of parts and get all your 3D data at once.
Once the scanning is complete, the real magic happens in the ZEISS INSPECT software. This software automatically generates a 3D volume and a digital twin of the scanned connector, allowing us to start measuring each pin position according to the drawing specifications.

One scan, multiple evaluation possibilities
One scan is all it needs to fully inspect your parts: 3D scanning with ZEISS METROTOM 1 offers a wide range of fast, accurate, and reliable inspections for measuring electronic components. This technology not only enhances the efficiency of the inspection process but also significantly improves the reliability of the measurements.
CAD comparison
If the CAD model of your part is already available, you can perform a quick CAD comparison to observe deviations across the entire part. For instance, if the inner portions of the pins appear blue relative to the rest of the part, this indicates that the interior cavities are too large, which may suggest a loose connector fit during operation.
Ensuring proper pin alignment
Proper alignment and positioning of pins are essential to ensure that electrical connections are made correctly. Any deviation from the specified positions could result in poor connectivity, signal loss, or even electrical shorts, which can severely impact the functionality of the device or the system it belongs to.
During the inspection, you can visualize the connector pin positions in color, making it easy to identify any discrepancies. ZEISS METROTOM 1 provides full 3D scan data, including details from deep regions or pockets that were previously inaccessible with other measurement systems.
Inspecting assembly states
Take quality control to the next level and start inspecting the connector in its assembly state by pairing it with its counterpart. After completing the scan, you can view the complete 3D volume of our scan. By switching to the quad view in the ZEISS INSPECT software, we can slice through the part in all three directions, allowing us to evaluate the state of the mating surfaces and interacting pieces.
While scrolling through the slices, you might discover a void in a portion of the component that clips together. This is a significant finding, as we do not want any voids in areas that may experience high stress.
Quantitative insights
After gathering qualitative insights, you can obtain quantitative data with just one click. ZEISS INSPECT allows you to create volume defect elements that automatically identify all voids from the scan. This feature enables you to analyze aspects such as global porosity, defect distance from the surface, and sphericity.
For example, you can easily examine individual defect volumes, which will be color-coded based on their sizes. This visualization can be done in both 3D and 2D, providing a comprehensive understanding of the internal structure.
Additionally, by right-clicking the color legend, you get to change the color map to a pass/fail visualization based on previously determined volume tolerances.